

One of the most important
processes in the atmosphere is the ozone regeneration in the
recombination
process (1) (see Fig. 1). A
large body of data show that vibrationally-excited ozone molecule O3(υ)
forms in the process (1). There are
two pathways that determine the fate of the formed O3(υ)
as shown on Fig. 1. Part of O3(υ) are stabilized via processes (3),
(4b) and (6). Interaction of vibrationally excited ozone with oxygen
atoms has
two product channels: collisional relaxation (4b) and chemical loss
(4a). In
the conditions of the upper atmosphere the radiative process (6)
contributes
significantly into overall vibrational relaxation rate of O3(υ).
Fig. 1. The kinetic scheme showing formation, destruction and stabilization pathways of vibrationally excited ozone molecule in the atmosphere.
Another part of O3(υ) is destroyed in the processes (2), (4a) and (5). Although the rate constant for O2(a1Δ) quenching by vibrationally cold O3 is small, the rate constant for quenching by vibrationally-excited O3 is much faster. Contribution of channel (4a) for O3(υ) destruction is significant in the upper atmosphere where high concentration of oxygen atoms take place. In addition, O3(υ) may be lost in reaction with other active species X (process (5)) such as NO, NO2, OH etc. Processes (2), (4a) and (5) result in a decrease of the rates of ozone formation and increase of O2(a1Δ) molecules and O atoms removal rates in the O/O2/O3 systems. This should be considered in the calculations of O, O3 and O2(a1Δ) profiles in the atmosphere and in the studies of oxygen species kinetics in the laboratories. The values of the rate constants of processes involving O, O3 and O2 species are the most sensitive parameters of atmospheric chemistry and processes (2), (4a) and (5) could introduce large systematic errors when they are measured.
We performed laboratory study of atmospheric processes involving singlet oxygen molecule O2(a1Δ), oxygen atom and ozone molecule. Figure 2 exhibits the overall view of experimental set-up. Oxygen atoms and O2(a1Δ) molecules were produced by UV laser photolysis of ozone. The kinetics of quenching were followed by observing the 1268 nm fluorescence. The temporal profiles of the oxygen atom concentrations were monitored by means of the O+NO chemiluminescent reaction. The time-resolved absorption spectroscopy was implied for O3 concentration measurements. The photolysis radiation was provided by an excimer laser (Lambda Physik Compex Pro 102, 10 ns pulse duration) operating at 248 nm (KrF) or 4th harmonic of Nd:YAG laser (Solar Systems LQ829, 10 ns pulse duration).
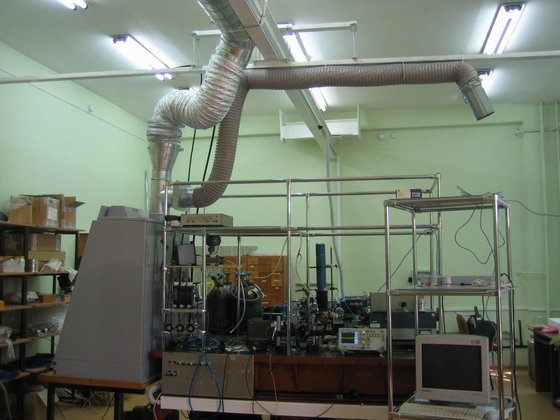
Fig. 2. The photo gives a close-up view of the working area of the photochemical laboratory.
The basic parts of apparatus are exhibited on photo 3. Photolysis cell has been described in recent publication (Azyazov V.N. et al. Chem. Phys. Lett., vol. 482, 2009, pp. 56-61, doi:10.1016/j.cplett.2009.09.095).
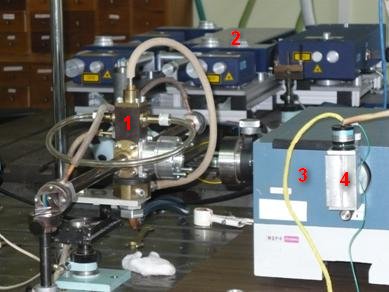
Fig. 3. Photo of the basic parts of apparatus. 1 – photolysis cell, 2 – laser system, 3 – monochromator, 4 - PMT.
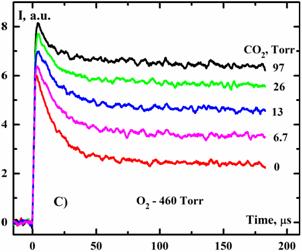
Fig. 4. Temporal profiles of the 1268 nm emission intensity I after laser photolysis of the mixtures O3/O2/CO2 at E=87 mJ/cm2 and T=300 K.
Two distinct time scales for
O2(a1Δ) fluorescence decay are evident in Fig. 4. Very rapid decay was observed over the first 30 msec. Beyond 30 ms the decay was much slower, occurring at a rate that was consistent with the quenching of O2(a1Δ) by ozone. The rapid quenching of O2(a1Δ) within the first 30 ms is unusual because O2(a1Δ) is extraordinarily resistant to collisions. The first O2(a1Δ) decay rates of could not be explained using the known rate constants for the binary reactions with O3, O2 and/or O(3P). Evidently, addition of CO2 suppress the fast quenching of O2(a1Δ). This result implies that CO2 is either inhibiting the formation of the quenching species or participating in the removal of that species.
2) Incomplete ozone
recovery effect.
Ozone density temporal profiles in the O2/O3/CO2/Ar
mixture at E=70 mJ/cm2, the total gas pressure Ptot
=712 Torr, PO2 =182 Torr,
T=300 K, the initial O3 density
N0O3=2.75x10¹⁶
cm-3 are exhibited on the Fig. 5. The pressures Ptot
and PO2 were kept constant. The Ar
and CO2
pressures were varied according to the relation PAr
+ PCO2= 530 Torr. Ozone
molecules were
dissociated by the laser pulse (about 55 %) and by chemical processes
involving
O(1D) (up to 15 %) at the time interval < 5
ms. CO2 is good quencher of O(1D)
therefore it suppresses
the ozone chemical removal in the initial stage
as can see from Fig. 5. Results presented on
Fig. 5 show that the ozone concentrations do not restore to its initial
value
at our experimental conditions. The removal rates of oxygen atoms in
the
well-known processes
O3 + O(3P) → O2
+ O2 (8)
are much smaller than the rate of process (1) and their contribution into the O atom removal are negligible at our experimental conditions. For the O2/O3/Ar mixture (the lower curve on Fig. 5) the degree of ozone recovery is about 70 %. Addition of CO2 through the replacement of Ar causes an increase of the degree of ozone recovery.
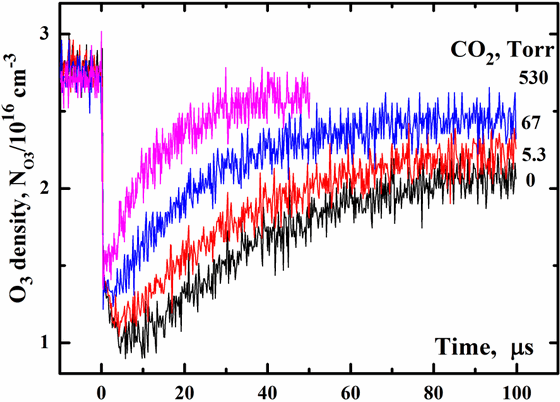
Fig. 5. O3 density temporal profiles at E=70 mJ/cm2, total gas pressure Ptot =712 Torr, PO2 =182 Torr, T=300 K for several CO2 pressure.
3) Ozone recovery rate slowing-down effect. We can see from Fig. 5 the ozone recovery rate depends strongly on the gas composition. For the O2/O3/Ar mixture (the lower curve on Fig. 5) the ozone recovery time tO3 is about 50 μs against expected 15 μs. Replacement of Ar by CO2 results in diminish of tO3. For the O2/O3/CO2 mixture (the upper curve of Fig. 5) the predicted and observed ozone recovery times are practically the same.Atmospheric applications. In the Earth’s middle atmosphere singlet oxygen O2(a1Δ) are produced mainly directly by the action of solar ultraviolet radiation that dissociates ozone. Vibrational states of ozone O3(υ) depart from local thermodynamic equilibrium due to chemical pumping through recombination process (1). Reaction (2) can noticeable contribute to the balance of singlet oxygen in the Earth’s middle atmosphere. The dominant collisional deactivation channel of O2(a1Δ) in the atmosphere is the process
O2(a1Δ) +O2(X3Σ) → 2 O2(X3Σ). (10)
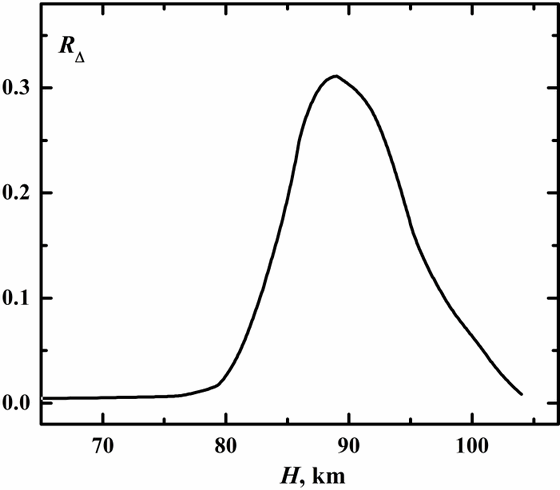
Let us estimate the ratio of the rate of O2(a1Δ) removal in the process (2) to the rate of the process (10)

The values of RΔ for atmospheric altitudes in the range from 60 to 105 km obtained using standard atmospheric concentrations are represented in Fig. 6. There is a sharp peak near 90 km where the rate of reaction (2) is of the same order of magnitude with the rate of reaction (10). Process (3) makes a major contribution into quenching of O3(υ) at altitudes below 90 km and process (4) above resulting in a maximum of O3(υ) concentration near 90 km. For altitudes below 80 km and above 105 km the contribution of process (2) into O2(a1Δ) balance compared to process (10) was found to be negligible.
![]()
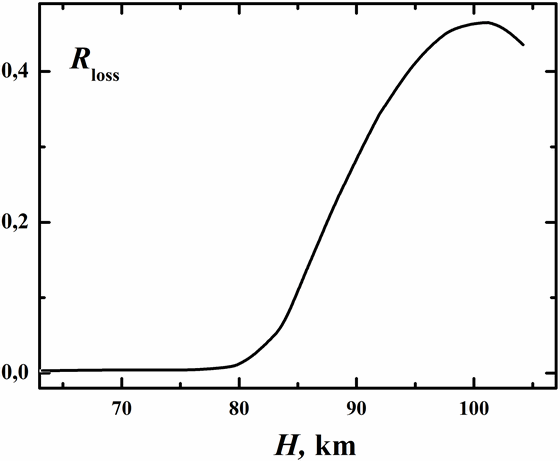
As illustrated in Fig. 7 at atmospheric altitudes less than 80 km generated O3(υ) is largely relaxed radiatively (process (6)) and collisionally with N2 and O2 (process (3)). For H≥80 km the contribution of process (3) into stabilization of ozone is negligible. Here O3(υ) is thermo stabilized via processes (4b) and (6). Chemical process (4a) results in significant loss of O3(υ) which may amount up to 50% at altitudes near 100 km. Process (4a) makes the main contribution into O3(υ) dissociation, whereas process (2) contributes only a few tenths of percent into O3(υ) chemical loss. It is worth to note that the rate of process (4a) is even comparable with the rate of ozone photodissociation at H≥80 km at daytime. Our estimations show that for altitudes near 100 km the rate of process (2) is of the same order of magnitude with the rate of chemical loss of vibrationally cold O3 by O and H atoms.
Vibrationally excited ozone is a significant quenching agent of O2(a1Δ) in the O/O2/O3 systems. The O, O2 and O3 species are the key components in atmosphere and oxygen containing plasma generators therefore it is necessary to take into account process (2) when modeling O2(a1Δ) and O3 concentration profiles.
Processes
(2) and (4a) can make large systematic errors to measurements of rate
constants
in the O/O2/O3 systems. The process (2) leads to
underestimating of the rate constant of O atom recombination process
due to
regenerating of oxygen atoms. Whereas process (4a)
results in
increasing of overall O atom removal rate and overestimating of the
values of
rate constant of process (1).
This work was suppoted by the Ministry of Education and
Science of Russian Federation under grant 16.740.11.0494.
→ N2 + O2(a1Δ, X3Σ) (b)
→ O(3P) + N2O (c)
We employed the 193 nm laser pulsed photolysis of N2O to produce O(1D) atoms. The kinetics of O2(a1Δ) production was followed by observing the 1268 nm fluorescence. Calibration of the O2(a1Δ) detection system was accomplished using 248 nm photolysis of O3/N2 mixtures.
O3+ 248 nm → O2(a1Δ) + O(1D)
→ O2(X3Σ) + O(3P)
The O2 a-X emission was monitored at 1268 nm with the slits of the monochromator set to provide a band-pass of about 30 nm FWHM. The trace labeled I(O3) in Fig. 8 shows a typical time-resolved O2(a1Δ) fluorescence intensity signal resulting from photolysis of O3. This trace was obtained at a total pressure of P(tot)=775 Torr with an O3 partial pressure of P(O3)=1.3 Torr. The signal level immediately after the photolysis pulse was proportional to the nascent O2(a1Δ) concentration resulting from photolysis.
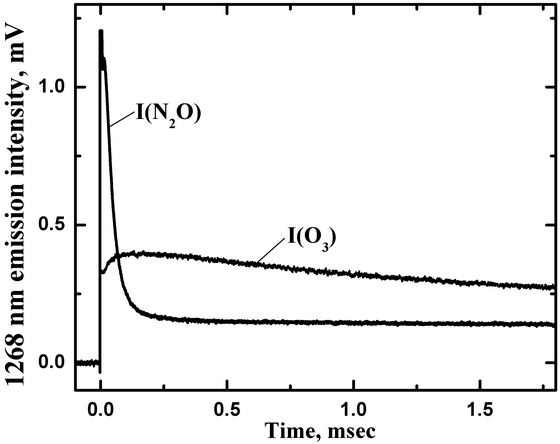
Figure 8. Temporal profiles of the 1268 nm emission intensities for O3 photolysis (I(O3)) with P(N2)=773.7 Torr and P(O3)=1.3 Torr, and N2O photolysis (I(N2O)) with P(N2O)=207 Torr and P(Ar)=407 Torr.
Ar was used as the diluent gas for N2O
because it has a low rate constant for quenching of O(1D)
(5x10-13 cm3/s)
as compared to the
rate constant for reaction with N2O (1.2x10⁻¹⁰ cm3s-1).
Emission at 1268 nm was readily observed following 193 nm photolysis
and the
dispersed fluorescence spectrum, observed using detection of long-lived
fluorescence, confirmed that the signal originated from
O2(a1Δ). The trace labeled I(N2O)
in Fig. 8 shows an example of the time-resolved 1268 nm signal for
photolysis
of an N2O/Ar mixture with P(N2O)=207 Torr
and P(Ar)=407 Torr.
The
rapidly decaying component at the beginning of this trace (0-0.2 ms)
resulted
from the formation of electronically excited NO2 via the
three-body
reaction
O(3P)+NO+Ar
→ NO2*+Ar
NO was present due to reaction (a) while trace amounts of O(3P) atoms were produced by photolysis and reaction (c). Note that extremely small concentrations of NO2* could yield signals that were comparable to those from O2(a1Δ) due to the huge difference (a factor of 108) in their radiative lifetimes. For the conditions of the measurements reported here the processes leading to NO2* formation were essentially concluded within 0.2 ms of the photolysis pulse. Back extrapolation of the long-lived fluorescence intensity (t>0.3 ms) was used to determine the O2(a1Δ) signal immediately after the photolysis pulse. It was found that the O2 produced by the reaction of O(1D) with N2O is almost entirely O2(a1Δ), as expected on the basis of spin correlation rules. Hence, the branching fraction for reaction (b) (0.38) is also the branching fraction for production of O2(a1Δ) (Azyazov V.N. et al., J. Phys. Chem. A., 2007, vol. 111, p. 6592-6599, doi: 10.1021/jp066531c). The relatively high yield of O2(a1Δ) raises the possibility that reaction (b) may contribute to the Earth’ s airglow. The UV photolysis of N2O is a convenient method for producing singlet oxygen in laboratory conditions for studying the kinetics of processes involving O2(a1Δ) (Azyazov V.N., Heaven M.C., Chem. Phys. Lett., vol. 502, 2011, pp. 150-153, doi: 10.1016/j.cplett.2010.12.053).
The main results:
1. Observed a fast singlet oxygen quenching effect in pure oxygen-ozone mixture. (Azyazov V.N. et al. Chem. Phys. Lett., vol. 482, 2009, pp. 56-61, doi: 10.1016/j.cplett.2009.09.095).
2. Observed an incomplete ozone recovery effect in pure oxygen-ozone mixture (Azyazov V.N. and Heaven M.C., 68th Intern. Symp. on Molecular Spectroscopy, 17-21 June 2013, Columbus).
3. Observed an o zone recovery rate slowing-down effect in pure oxygen-ozone mixture (Azyazov V.N. et al. 32nd Intern. Symp. on Free Radicals, 21-26 July 2013, Potsdam, Germany).
4. Measured the branching fraction for reactive channel for process of vibrationally excited ozone molecule with oxygen atom to be 0.8 (Azyazov V.N. and Heaven M.C., 68th Intern. Symp. on Molecular Spectroscopy, 17-21 June 2013, Columbus).
5. Measured the fraction of electronically excited oxygen molecule O2(a1Δ) produced by the reaction O(1D) + N2O → O2(a1Δ) + N2 to be > 0.9 (Azyazov V.N. et al., J. Phys. Chem. A., 2007, vol. 111, p. 6592-6599, doi: 10.1021/jp066531c).